-
FAQs
- About KB Add-ons
- Choosing the Ideal Hosting Plan to Suit Your Requirements
- Cloud FAQs: Answers to Common Questions
- Cloud FAQs: Answers to Common Questions, Part 2
- Cloud FAQs: Answers to Common Questions, Part 3
- Cloud FAQs: Answers to Common Questions, Part 4
- Cloud FAQs: Answers to Common Questions, Part 5
- Cloud VPS FAQs: Common Questions and In-Depth Answers
- Common Queries: Plesk FAQs
- Common Queries: Plesk FAQs, Part 10
- Common Queries: Plesk FAQs, Part 11
- Common Queries: Plesk FAQs, Part 12
- Common Queries: Plesk FAQs, Part 13
- Common Queries: Plesk FAQs, Part 2
- Common Queries: Plesk FAQs, Part 3
- Common Queries: Plesk FAQs, Part 4
- Common Queries: Plesk FAQs, Part 5
- Common Queries: Plesk FAQs, Part 6
- Common Queries: Plesk FAQs, Part 7
- Common Queries: Plesk FAQs, Part 8
- Common Queries: Plesk FAQs, Part 9
- Common Queries: Sucuri Web Security FAQs, Part 1
- Common Queries: Sucuri Web Security FAQs, Part 2
- Common Queries: Sucuri Web Security FAQs, Part 3
- Common Queries: Sucuri Web Security FAQs, Part 4
- Comparing Linux and Windows Hosting: Key Distinctions
- cPanel FAQs: Answers to Common Questions
- cPanel FAQs: Answers to Common Questions, Part 2
- cPanel FAQs: Answers to Common Questions, Part 3
- cPanel FAQs: Answers to Common Questions, Part 4
- Dedicated Server FAQs: Common Questions and In-Depth Answers
- Domain Name FAQs: Common Questions and In-Depth Answers
- Email Hosting FAQs: Answers to Common Questions
- Email Hosting FAQs: Answers to Common Questions, Part 2
- Email Hosting FAQs: Answers to Common Questions, Part 3
- Email Hosting FAQs: Answers to Common Questions, Part 4
- Exploring WordPress: Common Questions and Answers
- Exploring WordPress: Common Questions and Answers, Part 2
- Exploring WordPress: Common Questions and Answers, Part 3
- FAQs on SSL Certificate Renewal Processes and Procedures
- FAQs on SSL Certificate Renewal Processes and Procedures, Part 2
- FAQs on SSL Certificate Renewal Processes and Procedures, Part 3
- FAQs on SSL Certificate Renewal Processes and Procedures, Part 4
- FAQs on SSL Certificate Renewal Processes and Procedures, Part 5
- FAQs on SSL Certificate Renewal Processes and Procedures, Part 6
- FAQs on SSL Certificate Renewal Processes and Procedures, Part 7
- Google Workspace: Common Questions and Answers
- Google Workspace: Common Questions and Answers, Part 10
- Google Workspace: Common Questions and Answers, Part 2
- Google Workspace: Common Questions and Answers, Part 3
- Google Workspace: Common Questions and Answers, Part 4
- Google Workspace: Common Questions and Answers, Part 5
- Google Workspace: Common Questions and Answers, Part 6
- Google Workspace: Common Questions and Answers, Part 7
- Google Workspace: Common Questions and Answers, Part 8
- Google Workspace: Common Questions and Answers, Part 9
- Hidden Fees in Hosting Plans: What to Watch Out For
- Microsoft SharePoint FAQs: Common Questions and In-Depth Answers
- Microsoft SharePoint FAQs: Common Questions and In-Depth Answers, Part 2
- Microsoft SharePoint FAQs: Common Questions and In-Depth Answers, Part 3
- Microsoft SharePoint FAQs: Common Questions and In-Depth Answers, Part 4
- Shared Hosting FAQs: Common Questions and In-Depth Answers
- SSL certificate FAQs: Common Questions and In-Depth Answers
- SSL certificate FAQs: Common Questions and In-Depth Answers, Part 2
- SSL certificate FAQs: Common Questions and In-Depth Answers, Part 3
- SSL certificate FAQs: Common Questions and In-Depth Answers, Part 4
- Virtual Private Server (VPS) FAQs: Answers to Common Questions
- Virtual Private Server (VPS) FAQs: Answers to Common Questions, Part 2
- Virtual Private Server (VPS) FAQs: Answers to Common Questions, Part 3
- Virtual Private Server (VPS) FAQs: Answers to Common Questions, Part 4
- Web Hosting FAQs: Answers to Common Questions
- Web Hosting FAQs: Answers to Common Questions, Part 2
- Web Hosting FAQs: Answers to Common Questions, Part 3
- Web Hosting FAQs: Answers to Common Questions, Part 4
- Why is my domain not functioning?
- Show all articles ( 60 ) Collapse Articles
-
Other
- Azure Site Recovery (ASR) Overview and Its Role in Website Disaster Recovery
- Backup MX Explained: Functions and Benefits
- Browser Compatibility for RapidSSL, RapidSSL Wildcard, and Free SSL Certificates
- Cloud Hosting Explained: A Comprehensive Overview
- Content Delivery Networks (CDN): Their Role and Advantages
- Data Backup and Recovery: An In-Depth Exploration
- Decoding Website Malware: Definitions, Varieties, and Removal Techniques
- Dedicated Email Servers: An In-Depth Exploration
- Dedicated Hosting Explained: Its Significance and Key Benefits
- Dedicated Server: A Comprehensive Overview
- Digital Marketing: A Comprehensive Overview
- Disaster Recovery: Understanding How It Works
- Document Requirements for Purchasing an SSL Certificate
- Domain Transfers: A Comprehensive Overview
- Email Marketing: An In-Depth Overview
- Exploring Cloud VPN: A Comprehensive Overview
- Exploring Email Archiving: Functionality and Significance
- Exploring Email Hosting Options and Selecting the Ideal Provider
- Exploring KVM Virtualization: A Comprehensive Overview
- Exploring the Role and Functionality of Web Application Firewalls (WAFs)
- FTP Cloud Storage: A Comprehensive Overview
- Navigating Gmail: Features and Functions
- Navigating Google Admin: Features and Functions
- Navigating Google Apps Script: Features and Functions
- Navigating Google Calendar: Features and Functions
- Navigating Google Chat: Features and Functions
- Navigating Google Docs: Features and Functions
- Navigating Google Drive: Features and Functions
- Navigating Google Endpoint: Features and Functions
- Navigating Google Forms: Features and Functions
- Navigating Google Sheets: Features and Functions
- Navigating Google Slides: Features and Functions
- Navigating Google Vault: Features and Functions
- PPC Management: An In-Depth Overview
- Private Cloud Unveiled: Definition, Types, and Benefits
- Safeguarding Your Website: Strategies for Enhanced Security and Protection
- Shared Hosting: An In-Depth Overview of its Operation
- Smarter Tools: An In-Depth Exploration
- SSL Certificates: Securing Online Connections
- SSL Explained: How Secure Sockets Layer Works and Its Importance
- Understanding Brute Force Attacks and Effective Prevention Strategies
- Understanding Distributed Denial of Service Attacks
- Understanding Domain Names: Their Function and Significance
- Understanding Managed Cloud Services: Features and Benefits
- Understanding Search Engine Optimization (SEO) and its Significance
- Understanding SQL Injection Vulnerabilities
- Understanding the Cleanup and Protection Process with Sucuri Website Security
- Unraveling Cross-Site Scripting (XSS) Attacks: Types and Countermeasures
- VPS Hosting Demystified: Target Audience, Benefits, and Advantages
- WordPress Hosting Defined: A Comprehensive Explanation
- Show all articles ( 35 ) Collapse Articles
-
Domain Issues
-
- Domain name transfer status explained
- How long does a domain name transfer usually take?
- How to lock/unlock my domain name?
- How to restart your domain transfer if it has failed due to wrong EPP code?
- How to transfer my domain to Webserver?
- How to transfer your domain name to another registrar?
- I have already confirmed my domain name transfer. How long does it take to complete?
- I have transferred my domain to you but it still points to the previous host
- My domain has expired. Can I transfer it to WebServer?
- What is the fee for domain transfers and what is included in the fee?
- Which domains can I transfer to WebServer?
- Will there be downtime during a domain transfer?
-
- Can I change the billing cycle for my domain renewal?
- Can I renew a domain name for less than a year?
- Can I renew my domain name with you only and let the hosting plan expire?
- How can I purchase a new domain name?
- How to rename my domain?
- My domain name is NOT registered/transferred to/by SiteGround, can I renew it with WebServer?
- What are .MY domain names?
- What is domain name registration?
- What to do if your domain is in Redemption period?
- What to do when your domain name has expired?
- Which domain extensions can I buy?
-
-
Email Support/ Server
- Advanced Techniques Settings: Speeding Up Outlook 2010 in Smarter Mail
- Advanced Techniques: Completely Removing Smarter Mail from the Server
- Advanced Techniques: Configuring Key Ports for Smarter Mail
- Advanced Techniques: Data Protection with Backup and Restore in Smarter Mail
- Advanced Techniques: Detecting and Mitigating Compromised Accounts in Smarter Mail
- Advanced Techniques: Diagnosing and Fixing -1603 Error During Smarter Mail Upgrade
- Advanced Techniques: Diagnosing and Fixing SMTP Problems in Smarter Mail on AWS
- Advanced Techniques: Diagnosing and Recovering Unexpected Deletions in Smarter Mail
- Advanced Techniques: Diagnosing and Resolving Issues with UNC Paths in Smarter Mail
- Advanced Techniques: Diagnosing and Resolving Spool Overflow in Smarter Mail
- Advanced Techniques: Domain Migration from One Smarter Mail Server to Another
- Advanced Techniques: Domain Relocation within Smarter Mail Server
- Advanced Techniques: Downgrading Smarter Mail from Licensed to Free Version
- Advanced Techniques: eM Client IMAP Connectivity Issues in Smarter Mail
- Advanced Techniques: Email and Account Restoration in Smarter Mail
- Advanced Techniques: Free Gateway Setup with Smarter Mail
- Advanced Techniques: MAPI Account Replacement Strategies in Smarter Mail
- Advanced Techniques: Navigating "No Subject" or "No Sender" Messages in Smarter Mail
- Advanced Techniques: Rectifying and Improving User Disk Space Information in Smarter Mail Reports
- Advanced Techniques: Resetting Admin Username and Password in Smarter Mail
- Advanced Techniques: Robocopy for Smarter Mail Server Migration
- Advanced Techniques: Securing Smarter Mail with SSL/TLS Encryption
- Advanced Techniques: Server Migration for Smarter Mail
- Advanced Techniques: Setting Up Incoming Gateways and Sender Verification in Smarter Mail
- Advanced Techniques: Smarter Mail ActiveSync Integration with IIS
- Advanced Techniques: Smarter Mail after changing the Windows locale
- Advanced Techniques: Smarter Mail Backup Automation with RoboCopy
- Advanced Techniques: Speeding Up Send and Receive in Outlook 2010 with Smarter Mail
- Advanced Techniques: Speeding Up SMTP Connections in Smarter Mail
- Advanced Techniques: Transitioning Smarter Mail from Hosted to Self-Installed Setup
- Comprehensive Guide to Disk Space Discrepancies: Troubleshooting in Smarter Mail
- Efficient Service Switch: Migrating an Account into Smarter Mail
- Migrating from Microsoft 365 to Smarter Mail: A Comprehensive Mailbox Guide
- Strategic Mail Management: Copying Sent and Received Email in Smarter Mail
- To create email account in SmarterMail v16
- Troubleshooting Communication Issues: Fixing the 'Unable to Communicate with Smarter Mail Service' Error
- Troubleshooting Log Access with "Access Denied" Errors in Smarter Mail
- Troubleshooting Server Issues in Smarter Mail
- Troubleshooting Smarter Mail: No Connection to 127.0.0.1:17001 - SocketException Error
- User-Friendly XMPP Setup: A Guide to Pandion Configuration in Smarter Mail
- Show all articles ( 25 ) Collapse Articles
-
Virtual Private Server (VPS)
- Accessing Your VPS: A Step-by-Step Login Guide
- Addressing IP Blacklisting: A Guide to Resolving Issues with Your VPS
- Analyzing RAM Usage in Detail: A Guide to Checking VPS Memory Consumption
- Checking IP Addresses on Your VPS: A Quick Guide
- Creating a Media Server: A Guide to Using the Plex VPS Template
- Empowering Your VPS: A Guide to Using Webmin and LAMP Panel
- Enabling Network File System (NFS) on Your VPS: A Comprehensive Guide
- Enhancing Security: A Guide to Setting Up a Firewall on Your VPS
- Enhancing Security: A Guide to Using SSH Keys on Your VPS
- Enhancing Security: A Guide to Utilizing the VPS Firewall
- Expanding Storage Capacity in a VPS: A Comprehensive Guide
- Exploring VPS Operating System Options: A Comprehensive Overview
- Linking Your Domain to a VPS: A Step-by-Step Guide
- Managing Disk Usage: A Guide to Enabling Disk Quota on Your VPS
- Managing VPS Logs: A Guide to Deleting Logs Safely
- Maximizing Efficiency: A Guide to Using Portainer VPS Templates
- Migrating a Website from cPanel to Webmin: A Step-by-Step Guide
- Migrating from Plesk to cPanel: A Comprehensive Step-by-Step Guide
- Monitoring VPS Resource Usage: A Comprehensive Guide
- Optimizing Your VPS with CentOS Panel: A Comprehensive Guide
- Optimizing Your VPS: Enabling nginx-Varnish-Apache and PHP-FPM with PHP 7 Extensions
- Plesk Onyx and Your VPS: A Comprehensive Guide to Optimization
- Protecting Your VPS: Strategies for Preventing Abusive Activity
- Recovering from a VPS Security Breach: Essential Steps to Take
- Resetting Login Credentials on Your VPS: A Step-by-Step Guide
- Resolving 'Host Key Verification Failed' Error: A Comprehensive Guide
- Resolving 'Your Connection is Not Private' Error When Logging Into Your VPS: A Troubleshooting Guide
- Restoring MySQL Databases from Data Files in a VPS: A Step-by-Step Guide
- Securing Connections: A Guide to Connecting to Your VPS via SSH
- Securing Your Data: A Guide to Backing Up and Restoring a VPS Server
- Securing Your VPS: A Guide to Installing SSL with Certbot
- Securing Your VPS: A Guide to SSL Installation
- Troubleshooting Connection Issues: Unable to Connect to a Remote URL with Let's Encrypt Certificate on VPS
- Understanding and Resolving VPS License Block Issues
- Understanding CPU Usage Limits for VPS: A Comprehensive Overview
- Unlocking Containerization: A Guide to Using Docker VPS Templates
- Unlocking Potential: A Guide to Using cPanel and WHM Panel with Your VPS
- Updating Your VPS Hostname: A Step-by-Step Guide
- Upgrading Your VPS Server: A Comprehensive Guide
- VPS Migration: A Step-by-Step Guide to Moving Your Server to Another VPS
- Show all articles ( 25 ) Collapse Articles
-
WordPress
- Accessing Your WordPress Dashboard: A Quick Guide
- Activating Maintenance Mode in WordPress: A Simple Guide
- Bringing Your Vision to Life: Installing WordPress Themes
- Building Your Personal WordPress Website: A Step-by-Step Guide
- Crafting Content in the WordPress Editor: A Comprehensive Guide
- Creating Dynamic Navigation: A Guide to WordPress Menus
- Customizing Your Website Look: Changing Themes and Appearance in WordPress
- Effortless Event Management: A Guide to WordPress Event Calendar Plugins
- Elevating Website Design: A Guide to WordPress Slider Plugins
- Engaging Visitors: Implementing Live Chat in WordPress
- Enhancing User Engagement: A Guide to WordPress Popup Plugins
- Enhancing User Feedback: A Guide to WordPress Review Plugins
- Enhancing WordPress Performance: Strategies for Optimization
- Enhancing Your WordPress Website: A Guide to Plugin Installation
- Exploring Tables in WordPress: A Comprehensive Overview
- Exploring the WordPress Dashboard: A Comprehensive Guide
- Exploring the WordPress Media Library: A Comprehensive Guide
- Keeping Your WordPress Up to Date: A Step-by-Step Guide
- Maintaining Your WordPress Site: A Guide to Updating Themes and Plugins
- Managing Comments in WordPress: A Complete Guide
- Manual WordPress Migration: A Step-by-Step Guide
- Navigating WordPress Tags: An In-Depth Exploration
- Optimizing Search Functionality: Exploring WordPress Search Plugins
- Optimizing URLs: A Guide to WordPress Permalinks
- Organizing Content: A Deep Dive into WordPress Categories
- Organizing Your WordPress Pages: A Step-by-Step Tutorial
- Producing content on WordPress: A guide to creating your first post
- Resetting Your WordPress Password: Step-by-Step Guide
- Securing Your Online Presence: Strengthening WordPress Security
- Securing Your WordPress Site: Strategies Against Spam and Threats
- Setting Up WordPress: Installation Guide for Beginners
- Understanding WordPress Links: A Comprehensive Overview
- Understanding WordPress User Roles: A Comprehensive Overview
- Upgrading PHP in WordPress: A Step-by-Step Guide
- WordPress Backup Essentials: How to Secure Your Website
- WordPress User Management: A Comprehensive Guide
- WordPress Website Maintenance: Best Practices and Tips
- Show all articles ( 22 ) Collapse Articles
-
PhpMyAdmin
- Checking PHPMyAdmin Status: A Quick Guide
- Configuring type of PHPMyAdmin Settings: A Comprehensive Guide
- Creating a Database Using PHPMyAdmin: Step-by-Step Tutorial
- Creating User Accounts in PHPMyAdmin: A Step-by-Step Tutorial
- Database Maintenance in phpMyAdmin: Repair and Optimization Guide
- Diving into Plugins in phpMyAdmin: An In-Depth Exploration
- Efficient Database Management with phpMyAdmin: A Comprehensive Tutorial
- Exploring Binary Logs in phpMyAdmin: A Comprehensive Guide
- Exploring Charsets in phpMyAdmin: A Thorough Guide
- Exploring Replication in phpMyAdmin: A Comprehensive Guide
- Exporting Databases or Tables in phpMyAdmin: A Comprehensive Tutorial
- How to use MySQL queries in PHPMyAdmin
- Importing a MySQL Database with PHPMyAdmin: Step-by-Step Instructions
- Installing PHPMyAdmin: A Step-by-Step Guide
- Mastering Operations in phpMyAdmin: A Comprehensive Tutorial
- Modifying Your Database with PHPMyAdmin: Step-by-Step Instructions
- To Backup MySQL Database Using PHPMyAdmin
- Understanding Storage Engines in phpMyAdmin: A Deep Dive
- Understanding Variables in phpMyAdmin: A Comprehensive Overview
- Show all articles ( 4 ) Collapse Articles
-
cPanel (Linux)
- Adding an SRV Record: Step-by-Step Instructions
- Analyzing Website Statistics: A Guide to cPanel Webalizer
- Analyzing Website Traffic: A Guide to cPanel Visitors
- Automating Email Responses: A Guide to Autoresponders in cPanel
- Combating Spam: A Guide to Apache SpamAssassin in cPanel
- Connecting Remotely: A Guide to cPanel's Remote MySQL Access
- Creating and Configuring Email Accounts in cPanel: A Step-by-Step Tutorial
- Creating and Managing Subdomains in cPanel: A Step-by-Step Guide
- Customizing cPanel: Exploring Styles
- Customizing Email Management: A Guide to Email Filters in cPanel
- Customizing Error Pages in cPanel: A Step-by-Step Guide
- Database Management with cPanel's phpMyAdmin: A Comprehensive Guide
- Efficient Email Forwarding: A Guide to Email Forwarders in cPanel
- Enhancing Security: A Guide to cPanel IP Blocker
- Enhancing Security: A Guide to Email Authentications in cPanel
- Expanding Your Web Presence: A Guide to Adding Addon Domains in cPanel
- Exploring Ruby on Rails in cPanel: A Comprehensive Guide
- Exploring the cPanel File Manager: A User's Guide
- File Transfer Simplified: A Guide to Using FTP in cPanel
- File Transfers Made Easy: A Guide to Using FileZilla FTP Client with cPanel
- How can I log in to my cPanel hosting account?
- How Do I Back Up My Site in cPanel
- Installing WordPress with cPanel: A Step-by-Step Guide
- Managing Contact Information in cPanel: A Step-by-Step Guide
- Managing FTP Sessions in cPanel: A Comprehensive Tutorial
- Managing Mail Exchanges: A Guide to cPanel MX Entry Configuration
- Mastering DNS Management: A Guide to cPanel's Advanced Zone Editor
- Mastering MySQL Databases in cPanel: A Comprehensive Guide
- Monitoring cPanel Bandwidth Usage: A Comprehensive Guide
- Monitoring cPanel Disk Space Allocation: A Step-by-Step Tutorial
- Monitoring DNS Changes: A Guide to cPanel's Track DNS Feature
- Monitoring Email Delivery: A Guide to Track Delivery in cPanel
- Monitoring Resource Usage: A Guide to CPU and Connection Usage in cPanel
- Navigating Webmail in cPanel: A Comprehensive User Guide
- Optimizing Website Performance: A Guide to cPanel's Optimize Website Feature
- Optimizing Website Performance: Integrating CloudFlare with cPanel
- Preventing Hotlinking: A Guide to Hotlink Protection in cPanel
- Raw Access Logs in cPanel: A Comprehensive Guide
- Redirecting Web Traffic: A Guide to URL Redirects in cPanel
- Safeguarding Your Data: A Guide to cPanel's Backup Wizard
- Scheduling Tasks: A Guide to cPanel Cron Jobs
- Securing Access: A Guide to Changing Passwords in cPanel
- Securing Communication: A Guide to Encryption in cPanel
- Securing Directories in cPanel: A Comprehensive Guide to Directory Privacy
- Securing Remote Access: A Guide to cPanel SSH/TLS Configuration
- Securing Your Website: A Guide to cPanel Virus Scanner
- Simplified App Installation: A Guide to cPanel Softaculous Apps Installer
- Simplifying Contact Management: A Guide to cPanel's Address Importer
- Simplifying Database Creation: A Guide to cPanel's MySQL Database Wizard
- Troubleshooting Website Errors: A Guide to cPanel Error Logs
- Understanding Aliases in cPanel: A Comprehensive Guide
- Understanding File Permissions in cPanel: A Detailed Guide
- Understanding Indexing in cPanel: A Comprehensive Guide
- Understanding MIME Types in cPanel: A Comprehensive Guide
- User Manager in cPanel: A Comprehensive Guide
- What happens after I purchase a web hosting?
- Working with Images in cPanel: An In-Depth Guide
- Show all articles ( 42 ) Collapse Articles
-
Plesk
- Accessing Plesk Control Panel: A Step-by-Step Login Guide
- Changing FTP Account Password in Plesk: A Step-by-Step Guide
- Copying Websites in Plesk: A Guide to Cloning Across Domains
- Creating Email Accounts in Plesk: A Step-by-Step Guide
- Creating New User Roles in Plesk: A Step-by-Step Guide
- Creating User Accounts in Plesk: A Step-by-Step Guide
- Deleting an FTP Account: Step-by-Step Guide
- Deleting Domains and Subdomains in Plesk Control Panel: A Step-by-Step Guide
- DNS Management in Plesk: A Comprehensive Guide
- Editing User Accounts in Plesk: A Step-by-Step Guide
- Editing User Roles in Plesk: A Step-by-Step Guide
- Exploring Disk Space in Plesk: A Comprehensive Guide
- Horde Webmail Email Forensics: Exploring Complete Headers in Plesk
- Mastering Patchman in Plesk: Access and Utilization Guide
- Plesk DKIM Setup: A Comprehensive Activation Guide
- Plesk Domain Management: How to Switch Primary Domains
- Plesk Email Alias Setup: A Step-by-Step Configuration Guide
- Plesk Email Control: A Guide to Black and White Lists
- Plesk Email Redirects: A Guide to Setting Up Mail Forwarding
- Plesk Greylisting Configuration: A Comprehensive Guide
- Plesk Let's Encrypt Setup: A Step-by-Step SSL Guide
- Plesk Panel Reset Password: Step-by-Step Guide
- Plesk SpamAssassin Activation: Step-by-Step Guide
- Plesk Website Metrics: A Guide to Checking Traffic
- Plesk WordPress Installation: Step-by-Step Domain Integration
- Removing User Accounts in Plesk: A Step-by-Step Guide
- Removing User Roles in Plesk: A Step-by-Step Guide
- Securing Directory Access: A Guide to Password Protection
- Setting Up Automatic Responses in Plesk: A Step-by-Step Guide
- Wildcard SSL Installation on Plesk Multi-Servers: Step-by-Step Guide
- Show all articles ( 15 ) Collapse Articles
-
Sucuri Website Security
- Configuring Backup Preferences Sucuri Firewall: A Comprehensive Guide
- Firewall IP Creation: A Guide to Generating Secure IP Addresses Sucuri Firewall
- Internal Domain Evaluation Sucuri Firewall
- Modifying Global Alert Options: Essential Steps for Customization Sucuri Firewall
- Monitoring Your Site: A Guide to Types and Frequency Sucuri Firewall
- Optimizing Support: How to Access General Help Services Sucuri Firewall
- Preventing Firewall Circumvention Sucuri Firewall
- Remote Scanner Site Addition: A Guide to Sucuri Firewall
- Securing Your Site: A Guide to Submitting a Malware Removal Request Sucuri Firewall
- SSL Certificate Installation Mastery Sucuri Firewall
- Sucuri Backup Activation: A Comprehensive Guide to Secure Backups
- Sucuri Backup Database Restore: A Guide to Successful Recovery
- Sucuri Backup File Restore: A Guide to Successful Website Recovery
- Sucuri Blank Screen Troubleshooting: A Step-by-Step Guide
- Sucuri Cache Cleanup: A Step-by-Step Tutorial
- Sucuri Cache Mastery: A Guide to Enabling Caching Modes
- Sucuri Cookie Management: A Guide to Blocking for Safety
- Sucuri File/Folder Management: A Guide to Whitelisting for Safety
- Sucuri Firewall Error Codes: Troubleshooting and Solutions
- Sucuri Firewall Geo-Protection: A Step-by-Step Blocking Guide
- Sucuri Firewall IP Blacklist: A Comprehensive Guide
- Sucuri Firewall IP Whitelist: A Comprehensive Guide
- Sucuri Firewall Page Protection: How to Safeguard Your Content
- Sucuri Firewall Referrer Blocker: A Comprehensive Guide
- Sucuri Firewall Setup: A Comprehensive Security Configuration
- Sucuri Firewall URL Path Restrictions: A Step-by-Step Tutorial
- Sucuri Firewall User Agent Blocking: A Comprehensive Guide
- Sucuri Login Guide: Accessing Your Security Dashboard
- Sucuri Protected Pages: A Guide to Activation and Setup
- Sucuri Server Side Scanner Management: A Guide to Setup
- Troubleshooting Sucuri Redirects: A Guide to Resolving Issues
- Web Security Unveiled: Exploring Sucuri Firewall Options
- Website Firewall Activation: A Step-by-Step Guide
- Show all articles ( 18 ) Collapse Articles
-
Microsoft Office 365
- Adjusting Thousand Separator in SharePoint Online: Step-by-Step Guide
- Assigning Microsoft 365 Licenses to User Accounts: A Step-by-Step Guide
- Bulk User Addition in Microsoft 365 Admin Center: A Step-by-Step Guide
- Comprehensive Guide: Create SharePoint Site Columns
- Comprehensive Guide: Rearranging Columns in SharePoint List View Forms
- Configuring Microsoft 365 Business Plan: A Step-by-Step Guide
- Configuring Office 365 Password Policies: A Step-by-Step Guide
- Efficient OneDrive File and Folder Sharing: A Comprehensive Guide
- Efficient OneDrive File Management: A Comprehensive Guide
- Email Message Management with Rules: A Comprehensive Guide
- Enhancing Data Retrieval: A Guide to Indexed Columns in SharePoint Lists
- Exploring Microsoft 365 Reports in Admin Center: A Comprehensive Overview
- Granting Unique Permissions to a Folder in SharePoint Online Document Library: A Step-by-Step Guide
- Installing the OneDrive App: Step-by-Step Guide
- Integrating a Domain with Microsoft 365: A Comprehensive Guide
- Manage User Accounts in Office 365: Enabling and Disabling Users
- Mastering File Uploads and Syncing with OneDrive: A Step-by-Step Guide
- Office 365 Mailbox Backup: A Comprehensive Guide Using eDiscovery Tool
- OneDrive Office Document Creation and Folder Creation: A Step-by-Step Guide
- Opening Documents OneDrive: A Guide to Using Office Online and Desktop Office Programs
- Optimizing Approval Processes: A Guide to SharePoint Content Approval
- Recovering Access: A Guide to Resolving Microsoft Account Lockouts
- Renaming Your Microsoft 365 Organization: A Step-by-Step Guide
- Setting Up Microsoft 365 Admin Business plan: Step-by-Step Guide with Setup Wizard
- SharePoint Alert Management: A Step-by-Step Guide
- SharePoint Attachment Management: A Tutorial on Disabling Attachments
- SharePoint Calendar Management: A Guide to Efficient Creation and Use
- SharePoint List Comment Administration: A Guide to Efficient Communication
- Survey Creation Mastery: A Comprehensive Guide for SharePoint
- Thumbnail Column Addition: A Comprehensive Guide for SharePoint Libraries
- Show all articles ( 15 ) Collapse Articles
-
Google Workspace
- Comprehensive Guide to Backing Up Google Workspace Drive Content
- Comprehensive Guide to Backing Up Google Workspace Email
- Comprehensive Guide to Backing Up Google Workspace Shared Drives
- Comprehensive Guide to Document Revisions in Google Docs: A How-To
- Comprehensive Guide to Retrieving Emails in Gmail: A How-To
- Comprehensive Guide to Safeguarding Google Workspace Data
- Comprehensive Guide to Starting with Google Workspace
- Comprehensive Guide: Integrating Google Workspace with Acronis Cyber Protect Cloud
- Creating Your Gmail Account: A Step-by-Step Guide
- Domain TXT Record Verification: A Guide to Secure Authentication
- Efficient Communication through Comments: A Guide in Google Docs
- Efficient Document Dictation: A Guide to Voice Typing in Google Docs
- Efficient Document Management: A Guide to Effective File Handling in Google Docs
- Efficient Document Navigation: A Guide to Internal Linking in Google Docs
- Efficient Document Ownership Changes: A Guide in Google Docs
- Efficient Document Transformation: A Guide to Converting and Printing in Google Docs
- Efficient Document Writing: A Guide to Smart Compose in Google Docs
- Efficient Editing with Suggestion Mode: A Guide in Google Docs
- Email Management Mastery: A Comprehensive Guide for Gmail Users
- Email Response Mastery: A Guide to Efficiently Reply in Gmail
- Google Docs Activity Dashboard Mastery: A Comprehensive Guide
- Google Docs Attachment Mastery: A Comprehensive Guide to Emailing Docs
- Google Docs Collaboration Mastery: A Comprehensive Guide
- Google Docs Offline Mastery: A Step-by-Step Tutorial for Users
- Google Docs Translation Essentials: A How-To Guide for Users
- Mobile Email Mastery: A Comprehensive Guide to Gmail on Smartphones
- Optimizing Cloud Storage: A Comprehensive Guide to Uploading Files
- Optimizing Communication: A Step-by-Step Guide to Sending Emails
- Optimizing Content Creation: A Comprehensive Guide to Google Docs
- Optimizing Video Conferencing: Hosting Meetings in Google Meet
- Optimizing Video Conferencing: Joining Meetings in Google Meet
- Show all articles ( 16 ) Collapse Articles
-
Cloud
- Comprehensive Guide to Hyper-V Networking Setup: A How-To
- Comprehensive Guide to Processor and Memory Allocation in Hyper-V: A How-To
- Comprehensive Guide to Proxmox Disk Configuration: A How-To
- Efficient Authentication: A Guide to Login and Logout in Proxmox Backup
- Efficient Backup Maintenance: A Guide to Pruning and Removal in Proxmox
- Efficient Data Protection: A Guide to Encryption in Proxmox
- Efficient Datastore Administration in Proxmox: A Guide to Optimal Practices
- Efficient Live Migration Execution: A Guide in Hyper-V Console
- Efficient Server Role Setup: A Guide to GUI-Based Hyper-V Installation
- Efficient SSL Certificate Management in Proxmox: A Comprehensive Guide
- Efficient Virtualization Setup: A Guide to Installing Hyper-V on Windows
- Enhancing File Layout Efficiency in Proxmox: Strategies and Techniques
- Enhancing Virtual Machine Reliability: Enabling Hyper-V Replica
- Enhancing ZFS Administration Efficiency in Proxmox: Strategies and Techniques
- Hyper-V Checkpoint Mastery: A Comprehensive Guide
- Hyper-V Environment Management Mastery: A Comprehensive Guide
- Hyper-V Failover Cluster Mastery: A Comprehensive Installation Guide
- Hyper-V Host Connectivity Mastery: A Comprehensive Guide
- Hyper-V iSCSI Storage Mastery: A Comprehensive Configuration Guide
- Hyper-V Kerberos Constrained Delegation Mastery: A Comprehensive Guide
- Hyper-V Live Migration Setup Mastery: A Comprehensive Guide
- Hyper-V SMB 3.0 File Server Setup Mastery: A Comprehensive Guide
- Hyper-V Storage Migration Mastery: A Comprehensive Guide
- Hyper-V Virtual Machine Creation Mastery: A Comprehensive GUI Guide
- Hyper-V Virtual Machine Replication Mastery: A Comprehensive Guide
- Hyper-V Virtual Switch Mastery: A Comprehensive GUI Guide
- Proxmox Backup Group Ownership Mastery: A Step-by-Step Tutorial for Users
- Proxmox Backup Mastery: A Comprehensive Guide
- Proxmox Client Installation Essentials: A How-To Guide for Users
- Proxmox Data Restoration Mastery: A Step-by-Step Tutorial for Users
- Proxmox Network Administration: A Comprehensive Guide
- Proxmox Server Installation Mastery: A Comprehensive Guide
- Proxmox ZFS Mastery: A Step-by-Step Tutorial
- Virtual Machine Cloning Mastery: A Comprehensive Guide to Library Integration
- Show all articles ( 19 ) Collapse Articles
-
Smarter Tool
-
- A Comprehensive Guide to Automatic Live Chat Deactivation in Smarter Track After Hours
- A Comprehensive Guide to Email Client Ticket Responses in Smarter Track
- A Comprehensive Guide to Transferring Tickets Across Multiple Smarter Track Instances
- Admin Guidelines: Setting Up Privacy Policy Consent for Submissions in Smarter Track
- Brand Styling Mastery: Adding Your Touch with Custom CSS in Smarter Track
- Comprehensive Guide to Automated Email Sending in Smarter Track
- Comprehensive Guide to Establishing MSSQL Server Dependency in Smarter Track
- Comprehensive Guide to Monitoring Agents' Active Groups and Workload in Smarter Track
- Comprehensive Guide to Resolving Attachment Problems in Smarter Track
- Comprehensive Guide to Resolving Live Chat Display Problems in Smarter Track
- Comprehensive Guide to Smarter Track Administrator Password Recovery
- Comprehensive Guide to Transitioning from Licensed to Free Smarter Track Version
- Comprehensive Guide to Updating Database Connection String in Smarter Track
- Enhancing Moderation: A Guide to Restricting Posts in Smarter Track Threads
- Enhancing Navigation: How to Generate Links to Individual Replies in Smarter Track Threads
- Guide to Crafting Automated Messages for Smarter Track Live Chats
- Guide to Crafting Private Categories within the Smarter Track Community
- Guide to Establishing Agent Status-Triggered Events in Smarter Track Live Chat
- Guide to Establishing Agent Status-Triggered Events in Smarter Track Tickets
- Managing Post Status: How to Flag a Community Post as Unread in Smarter Track
- Migrating Smarter Track to a New Server: Comprehensive Instructions
- Personalizing Communication: A Guide to Custom Portal Messages in Smarter Track
- Smarter Track Event Automation: Streamlining Live Chat with Agent Status Triggers
- Smarter Track Event Automation: Streamlining Processes with POP and SMTP Triggers
- Smarter Track Event Automation: Streamlining Processes with Ticket Time Log Triggers
- Smarter Track Event Automation: Streamlining Ticket Workflows with Agent Status Triggers
- Thread Spotlight: A Guide to Sticking Community Posts at the Top in Smarter Track
- Transitioning to Hosted Smarter Track: A Comprehensive Migration Guide
- Troubleshooting HTTP Error 503 in Smarter Track: Service Unavailability Solutions
- Troubleshooting Outgoing Calls: Smarter Track Communicator Ringing Issues
- Show all articles ( 15 ) Collapse Articles
-
- A Guide to Smarter Stats: Leased License Deactivates
- A Guide to Smarter Stats: Locating and Accessing IIS Log Files
- A guide to Smarter Stats: scheduled email reports that are not sent regularly
- A Guide to Smarter Stats: Use more or less system resources
- Comprehensive Guide to Admin Username and Password Reset in Smarter Stats
- Comprehensive Guide to Apache Log File Access using Smarter Stats
- Comprehensive Guide to Backing Up and Restoring Smarter Stats Data
- Comprehensive Guide to Critical Log Files in IIS for Smarter Stats
- Comprehensive Guide to HTTPS Enforcement for Traffic in Smarter Stats
- Comprehensive Guide to IE Document Mode Configuration in Smarter Stats
- Comprehensive Guide to IP Exclusion in Smarter Stats Log Imports
- Comprehensive Guide to Log Source Setup with Mapped Drives and UNC Paths in Smarter Stats
- Comprehensive Guide to Logging Setup in IIS for Smarter Stats
- Comprehensive Guide to Modifying Login Attempts in Smarter Stats
- Comprehensive Guide to Recreating CEO and Marketing Overview in Smarter Stats
- Comprehensive Guide to Rows Configuration in Smarter Stats Reports
- Comprehensive Guide to Smarter Stats Relocation on a New Server
- Comprehensive Guide to Smarter Stats SiteConfig.xml Retrieval: A How-To
- Comprehensive Guide to SmarterLog Integrity: Preventing File Corruption in Smarter Stats
- Comprehensive Guide to Transferring Smarter Stats Data Across Hard Drives
- Efficient Resource Management in Smarter Stats: Configuration Guide
- IE Rendering in SmarterStats: How to Set Document Mode to IE 8
- Internet Explorer 11 Issues in Smarter Stats: A Usability Troubleshooting Guide
- Smarter Stats Edition Reversion Mastery: Transitioning to the Free Version
- Smarter Stats Reporting: How to Re-create the Site Activity Report
- Smarter Stats Reporting: How to Re-create the Site Usage Report
- Smarter Stats Reporting: How to Re-create the Site User Report
- Smarter Stats Reporting: How to Re-create the Webmaster Report
- Smarter Stats Site Migration Mastery: A Step-by-Step Tutorial
- Troubleshooting Absent Bandwidth and Referral Information in Smarter Stats
- Show all articles ( 15 ) Collapse Articles
-
-
Drupal
- Adjusting User Account Settings in Drupal: Configuration Steps
- Building a Content Item in Drupal: Step-by-Step Creation
- Building a Content List View in Drupal: A Step-by-Step Guide
- Cache Clearing in Drupal: A Step-by-Step Guide for Optimization
- Changing User Roles in Drupal: Step-by-Step Guide
- Cloning a View in Drupal: A Step-by-Step Guide
- Configuring Image Styles in Drupal: Step-by-Step Setup Guide
- Configuring Taxonomy in Drupal: Step-by-Step Setup Guide
- Crafting Custom Blocks in Drupal: A Step-by-Step Guide
- Creating a Content Type in Drupal: Step-by-Step Guide
- Creating a Development Site in Drupal: A Step-by-Step Guide
- Customizing Content Display in Drupal: A Step-by-Step Guide
- Customizing Content Entry Forms in Drupal: A Step-by-Step Guide
- Customizing Text Formats and Editors in Drupal: A Configuration Guide
- Customizing the Drupal Theme: Configuration Guide
- Drupal Administrative Perspective: An Insightful Overview
- Drupal Module Installation: Step-by-Step Guide
- Enabling Multilingual Capabilities in Drupal: A Step-by-Step Guide
- Enhancing Content Types with Basic Fields in Drupal: A How-To Guide
- Enhancing Content with the In-Place Editor in Drupal: A How-To Guide
- Establishing a Role in Drupal: Step-by-Step Guide
- Getting Ready for Drupal Installation
- Granting Permissions to a Role in Drupal: A Step-by-Step Guide
- Incorporating a Block Display into a View in Drupal: A Step-by-Step Tutorial
- Incorporating a Page into Drupal Navigation: Step-by-Step Guide
- Incorporating a Reference Field in Drupal: Step-by-Step Guide
- Installing Modules from Drupal.org in Drupal: A Step-by-Step Guide
- Installing Themes from Drupal.org in Drupal: A Step-by-Step Guide
- Locating Modules in Drupal: A Guide to Module Discovery
- Managing Content Authors in Drupal: Step-by-Step Guide
- Managing Maintenance Mode in Drupal: Enabling and Disabling Guide
- Manual Download of Module or Theme Files in Drupal: Step-by-Step Guide
- Modifying a Content Item in Drupal: A Step-by-Step Guide
- Module Update in Drupal: A Step-by-Step Guide for Keeping Current
- Monitoring Updates in Drupal: A Guide to Keeping Track
- Positioning a Block in a Region in Drupal: Step-by-Step Guide
- Removing a Content Type in Drupal: Step-by-Step Guide
- Removing Unused Modules in Drupal: Uninstallation Guide
- Reordering Navigation in Drupal: A Step-by-Step Guide
- Setting the Front Page for Your Drupal Site: Configuration Guide
- Setting Up a User Account in Drupal: Step-by-Step Guide
- Setting Up Cron Maintenance Tasks in Drupal: A Step-by-Step Guide
- Updating Basic Site Information in Drupal: A How-To Guide
- Upgrading Core Software in Drupal: A Step-by-Step Guide
- Show all articles ( 29 ) Collapse Articles
Monitoring VPS Resource Usage: A Comprehensive Guide
Monitoring VPS resource usage is crucial, as exceeding limits can negatively impact VPS performance due to incorrect configuration, insufficient resources, and other factors. Overcoming resource limits can cause server slowdown, server inaccessibility, and service failure.
a) Linux
Check CPU usage using the top command
1. First, log into your VPS via SSH and enter the top command to display all processes running on your VPS.
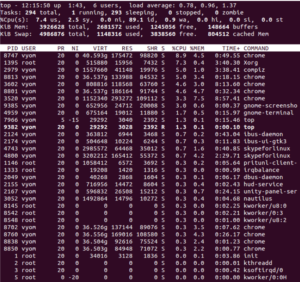
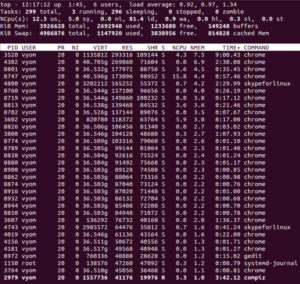
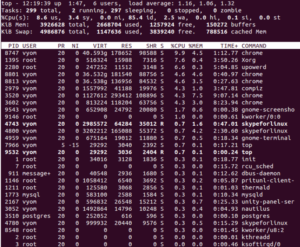
2. When you enter P in it, it will sort all running processes by CPU usage.
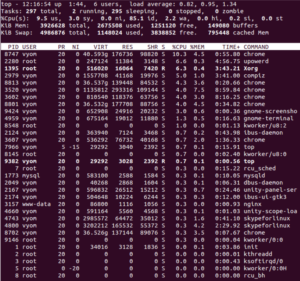
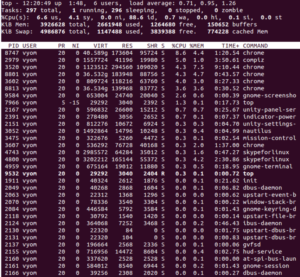
3. When you enter M there, it will sort all running processes by memory usage.
4. When you enter I in it, it will hide all idle processes.
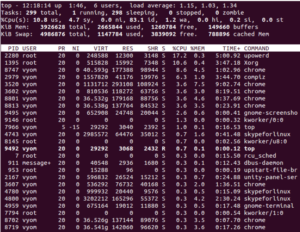
5. When you type S in it, it will sort all processes by their running time.
6. When you type U in it, it will view all processes owned by a specific user.
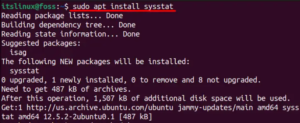
Check CPU usage using the mpstat command
1. First, log into your VPS via SSH.
2. Then, install the sysstat package using the apt-get install sysstat -y command for Debian/Ubuntu or yum install sysstat -y for CentOS/RHEL.
3. Next, use the mpstat command to display the usage of each processor.
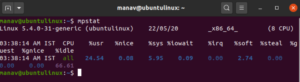
4. You can use and run the mpstat -P 0 command to display the first processor’s report.
5. You can also use and run the mpstat -P ALL command to display reports for all processors.
6. When you type the mpstat -P ALL 2 3 command in it, it will display the average CPU usage three times with an interval of two seconds.
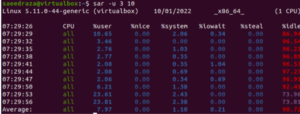
Check CPU usage using the sar command
1. First, log into your VPS via SSH and use the sar -u 2 command to track the CPU performance and display the CPU usage every 2 seconds.
Check CPU usage using the iostat command
1. First, log into your VPS via SSH and use the iostat command to display information about CPU utilization, device utilization, and network file system utilization.
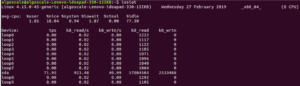
2. When you enter the iostat -c command in it, it will divide the CPU utilization into user processes, system processes, I/O waiting, and idle time.
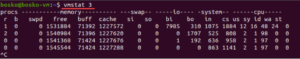
Check CPU usage using the vmstat command
1. First, log into your VPS via SSH and use the vmstat command to view system processes, memory, swap, I/O, and CPU performance since the last reboot.
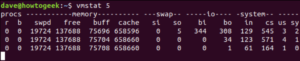
2. When you enter the vmstat 2 command there, it will update the vmstat report every 2 seconds.
b) Windows
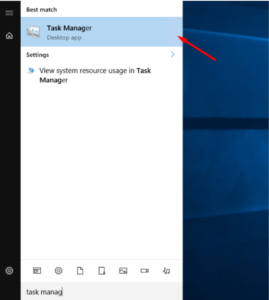
Check CPU usage using the Task Manager
1. First, log into your Windows VPS server and search for and open Task Manager.
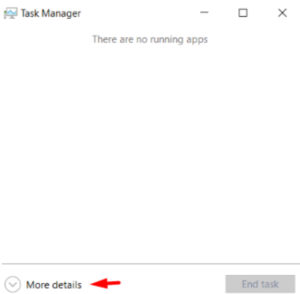
2. Then, click the More Details button.
3. Finally, navigate to Performance, where you can monitor the usage of CPU, Memory and Ethernet.
- CPU: Use this chart to check real-time CPU usage.
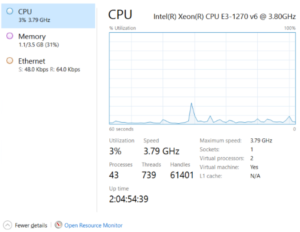
- Memory: Use these charts to check the real-time usage of memory (i.e., RAM).
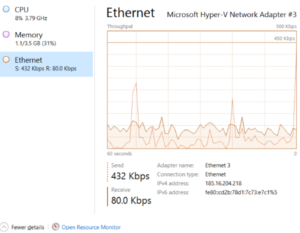
- Ethernet: Monitor the real-time usage of your Internet connection.
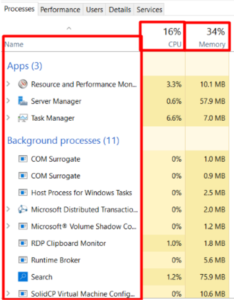
4. You can also perform process monitoring from the Processes tab to find more details about it.
Check CPU usage using the Resource Monitor
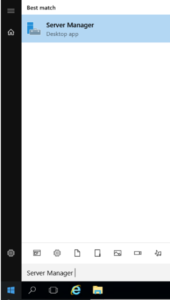
1. First, log into your Windows VPS server and search for and open Server Manager.
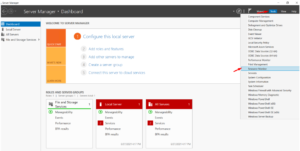
2. Next, navigate to Tools and select Resource Monitor.
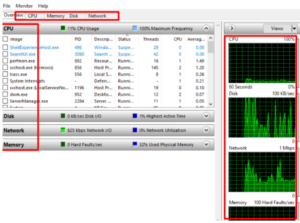
3. Then the real-time usage graph of CPU, memory, disk, and network will be displayed, which is the same as the task manager.
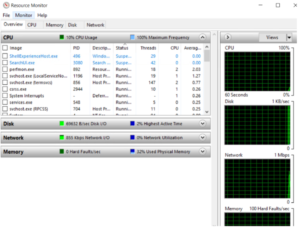
4. You can access each available option at the top to further analyze the usage of individual resources.
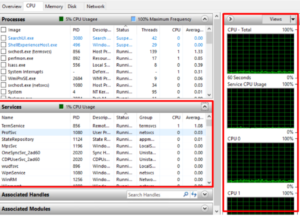
5. If you click “CPU,” it will display all real-time programs that consume a specific CPU amount, along with their status, PID, and description.
- Status: This indicates whether the process is currently running, active, or paused.
- PID: This stands for Process ID.
- Description: The description of the executable file is available.
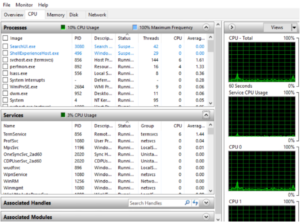
6. You can even monitor all service names running under the CPU and the usage of each CPU through charts.
7. If you click “Memory,” it will show all the live programs consuming a certain amount of RAM and their status: PID, Hard Fault, Commit, Working Set, Shareable, and Private.
- Status: This indicates whether the process is running, active, or paused.
- PID: This stands for Process ID.
- Hard Fault: average number of hard page faults per second in the last minute
- Commit: The amount of virtual memory reserved by the operating system for a process.
- Working Set: The amount of physical memory currently used by the process.
- Shareable: The amount of memory shared by one process that can be shared by another process.
- Private: the amount of memory used by a process that cannot be used by other processes.
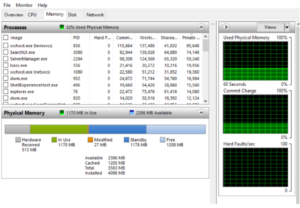
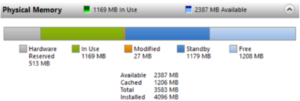
8. You can also check the reasonable usage of RAM through “Hardware Reserve“, “In Use“, “Modified“, “Standby” and “Free“.
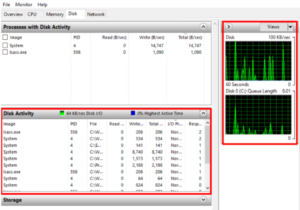
9. If you click on “Disk,” it will show all the live programs consuming a certain amount of storage, along with their status, PID, reads, writes, and totals.
- Status: This indicates whether the process is running, active, or paused.
- PID: This stands for Process ID.
- Reads: The average number of bytes read by the process in the last minute.
- Write: The average number of bytes written by the process in the last minute.
- Total: The average number of bytes accessed per second by the process.
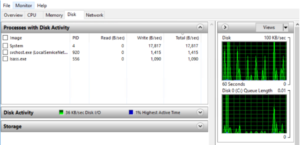
10. You can also monitor the program’s real-time disk activity through charts.
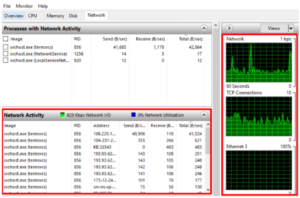
11. If you click on “Network,” it will show all the live programs that consume a certain amount of network, along with their name, PID, send, receive, and total.
- Name: Application name.
- PID: This stands for Process ID.
- Send: The number of bytes sent by the process in the last minute.
- Receive: The number of bytes received by the process in the last minute.
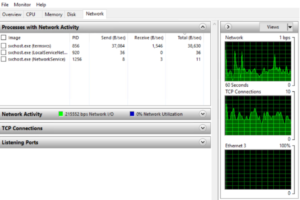
12. You can also monitor real-time network usage with the help of graphs and network activity tabs.
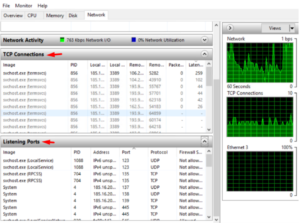
13. You can monitor TCP connections and listening port activity from the same option.
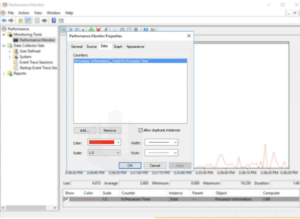
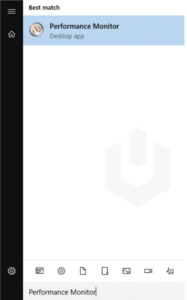
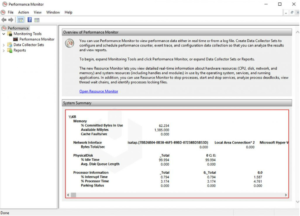
Check CPU usage using the Performance Monitor
1. First, log into your Windows VPS server and search for and open Performance Monitor.
2. It will then display an overview of the tool along with real-time statistics of physical memory, disk usage, network adapter, and processor usage.
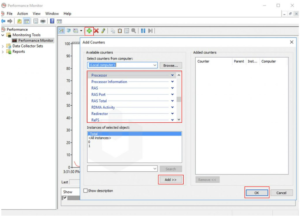
3. You can monitor the processor time counter in Performance Monitoring, which shows the load for the last 100 seconds.
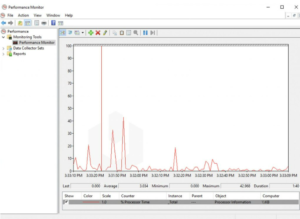
4. You can also easily monitor the chart by adding additional variables.
5. Then, right-click on the interface and select the Properties button to modify the chart settings and the monitor’s visual appearance.
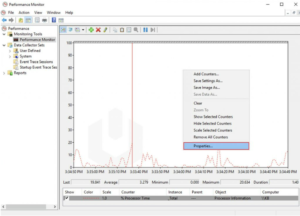
6. The Properties interface allows you to customize the data, graphics, and appearance of the Performance Monitor output.